Chin-Yi Cheng
2017

Sense the Green
Instructor: Roy E. Welsch, Professor of Statistics and Management Science and Engineering Systems, MIT
GIS interfaces, such as Google Maps, have become indispensable in our lives, and they are also a powerful tool for research. We can obtain different types of numerical data from the map, and even get a 3D model of buildings. However, I believe there is still one types of data that cannot be directly acquired from the GIS system—the distribution and characterization of trees and plants in a certain area.
In this project, my goal was to develop a visualize interface to distinguish the green areas on the map, and to find a way to evaluate the quality of that environment. I divided the process into three parts: distinguishing trees from the map, simplifying and classifying data, and creating the user interface. Although I used the very common regression tree model to separate colors from Google Maps, I also developed my own algorithms to cluster the trees for higher computational efficiency and proper classification.
1. Distinguish the Green Area
My goal in the first step was to obtain data from Google Maps and build a classification model to distinguish the green areas.


2. Cluster Data
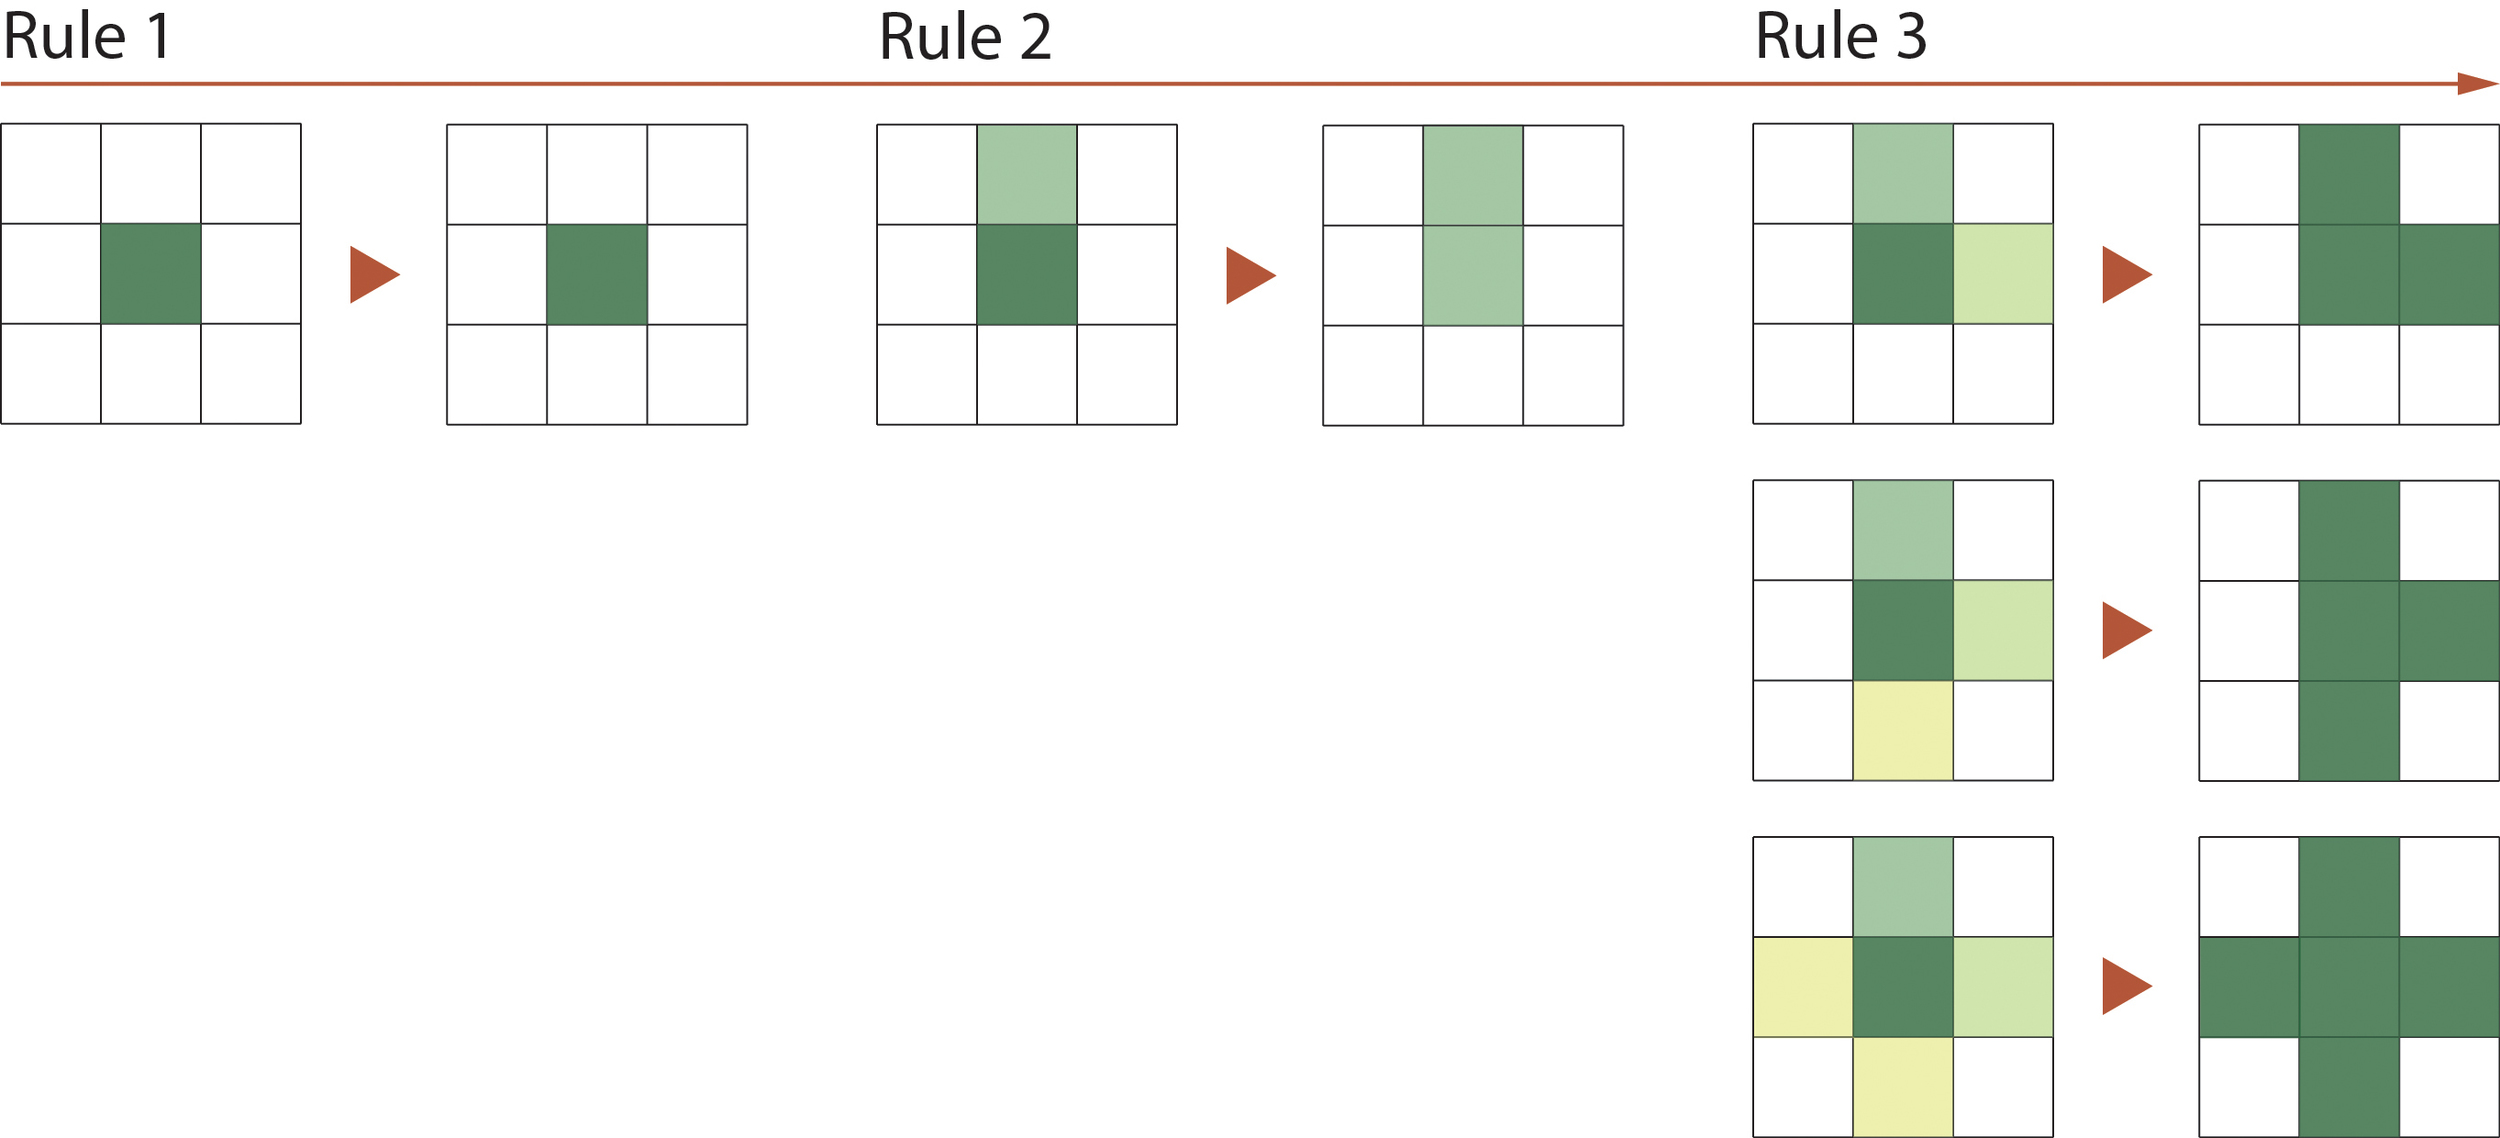
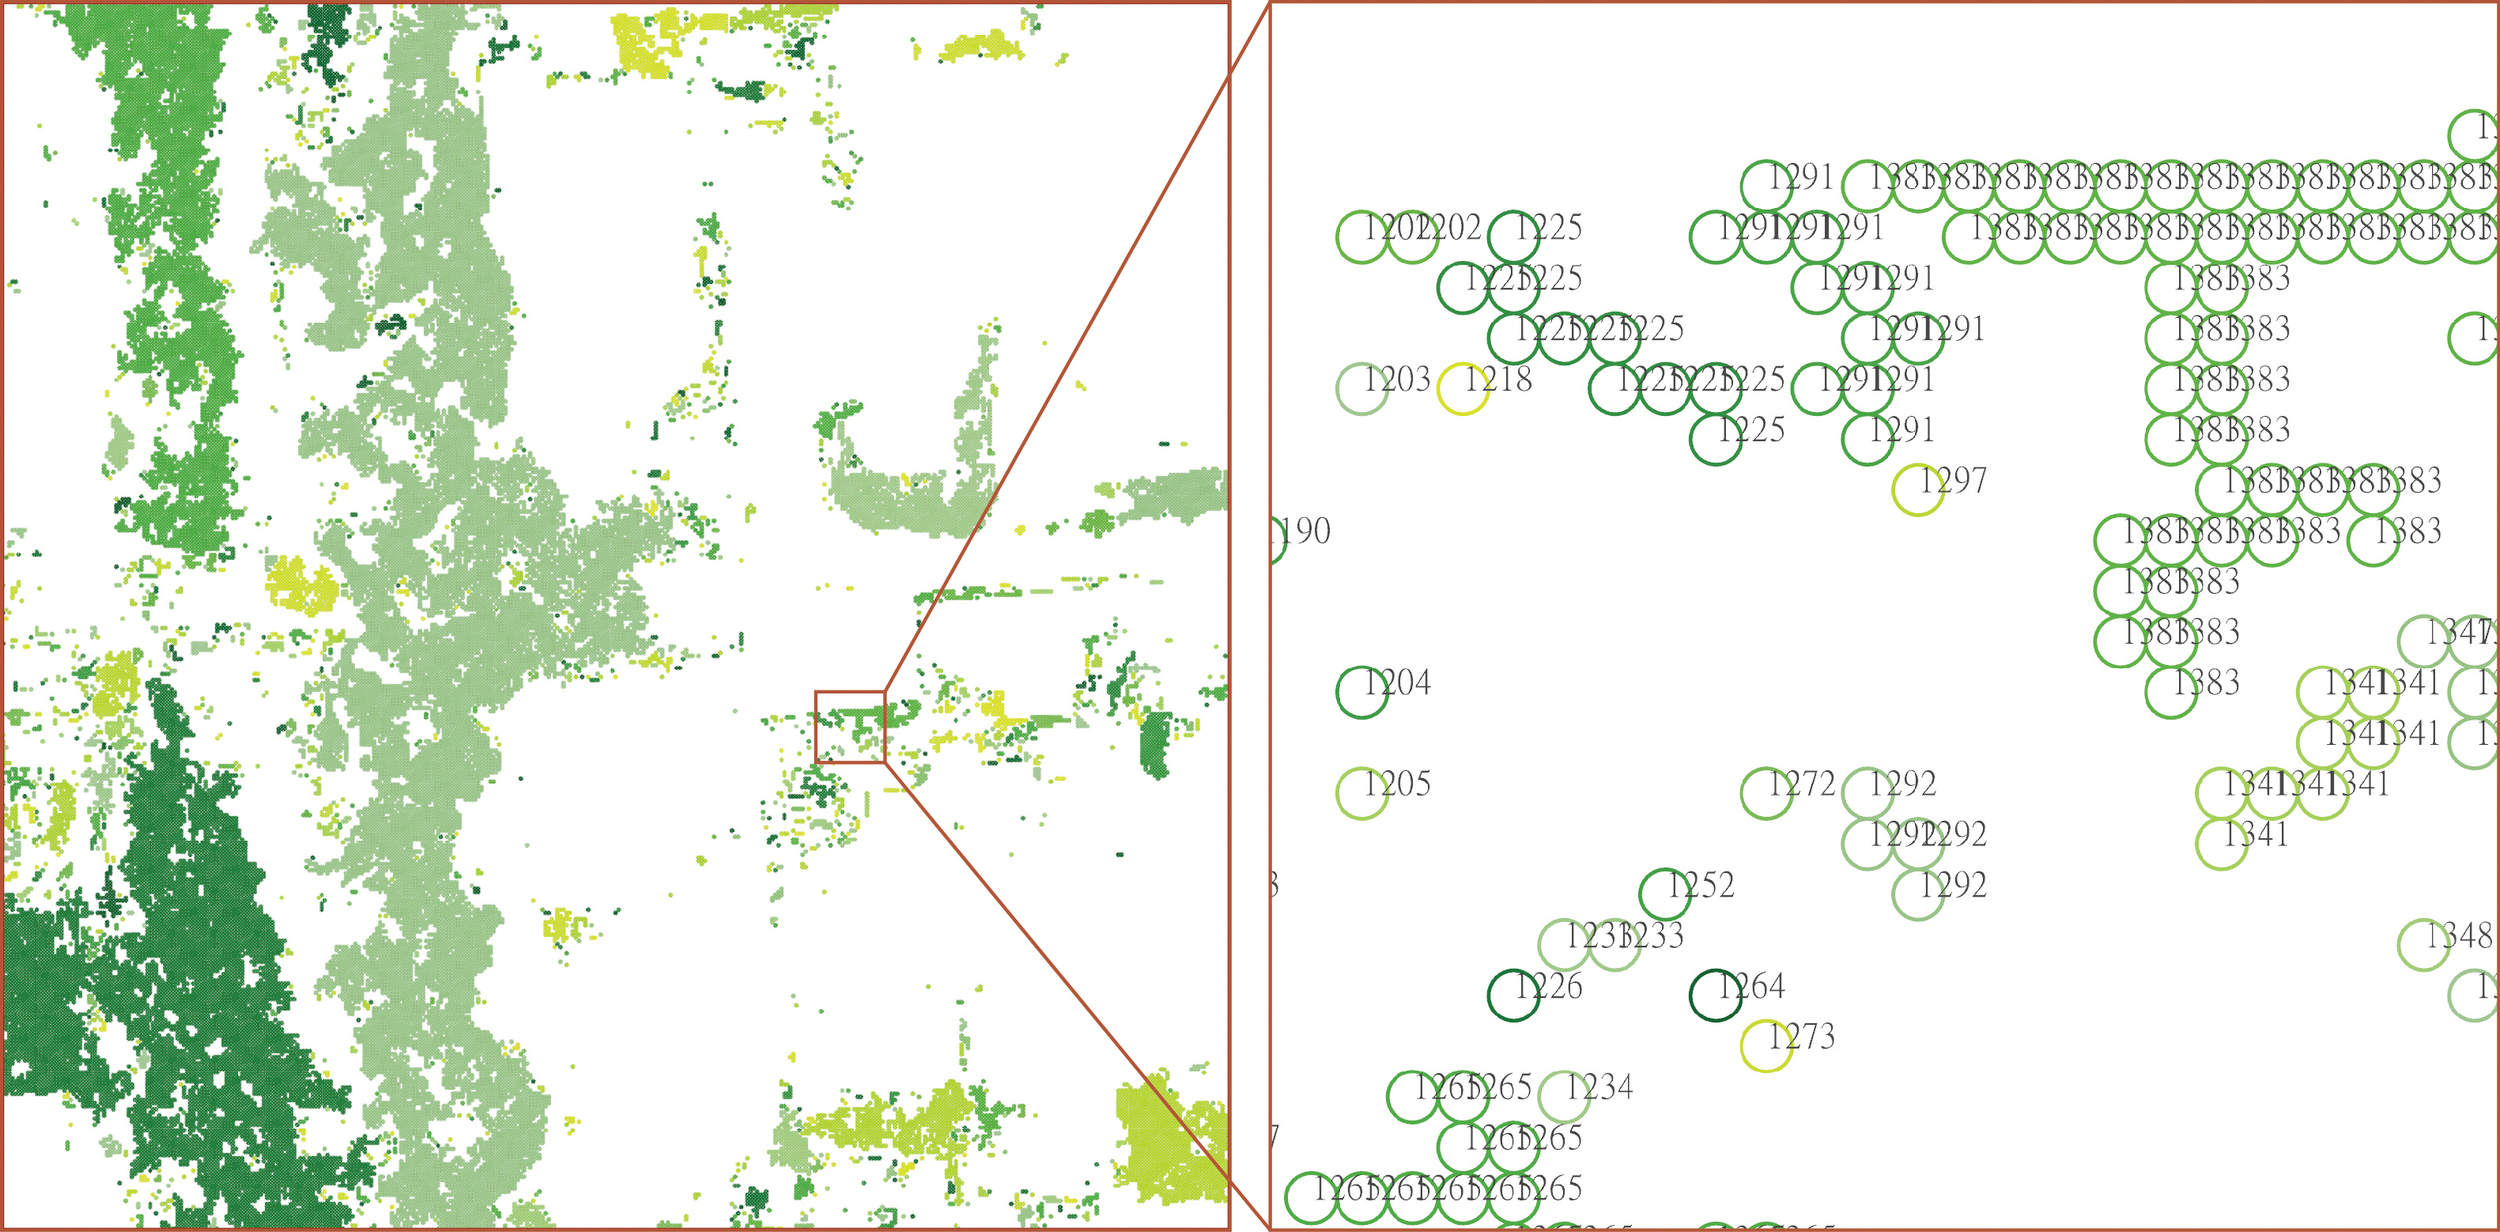
The green data now only contain the positions and colors. For further exploration of the green data in the area, we need to cluster and simplify them by their coordinates. I have tried different unsupervised learning algorithms to cluster the data, but they didn't work well. Therefore, I wrote a rule-based algorithm to identify the connection between pixels and successfully clustered the green areas.
3. Simplify Data
Although we already have clusters that can be used to further analysis, the amount of data is still too large. Clearly, the pixels inside each cluster are redundant, and some of the clusters have thousands of pixels. If we could remove these pixels, the amount of data would be several times smaller. Fortunately, one of the properties of my clustering algorithm is that every cluster is a continuous set of grid points. Therefore, when we walk along the outside boundary of a cluster, we can generate the bounding polygon for it (see diagram below). The idea to achieve this "walking" was also to analyze the basic patterns that would happen during the process:


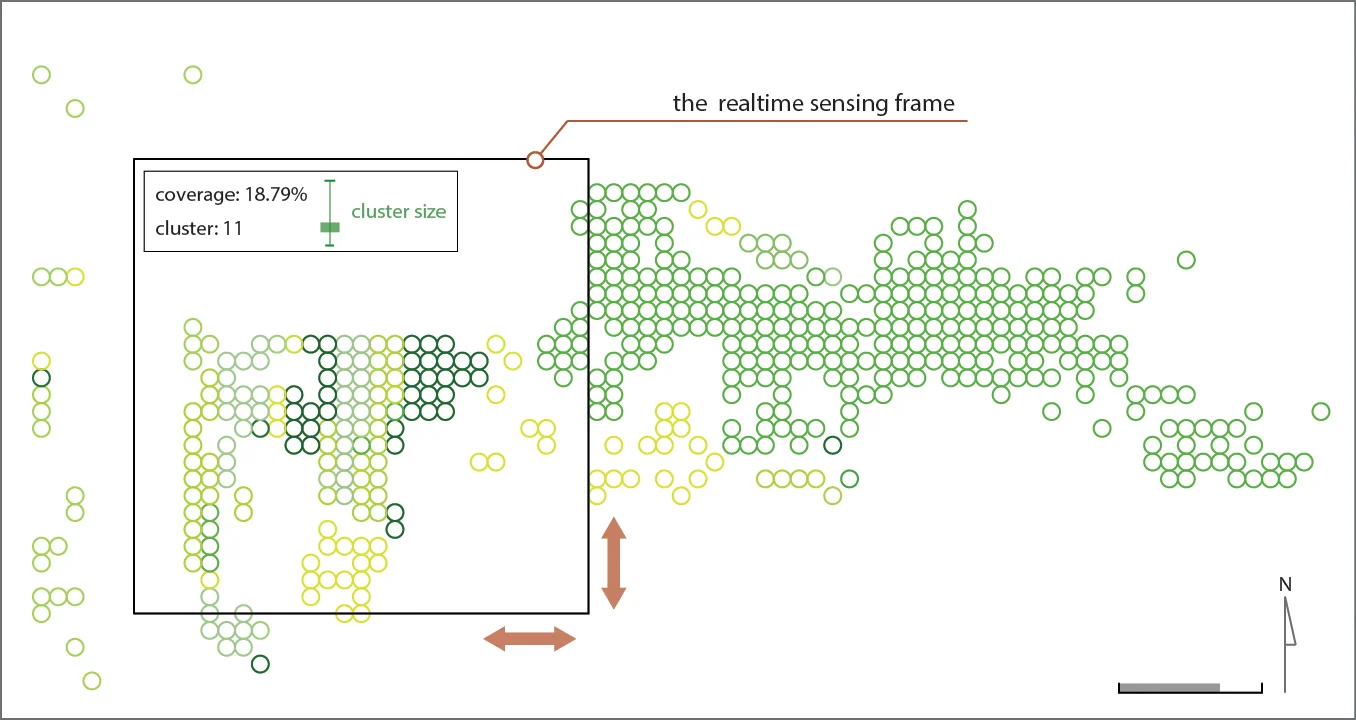
4. User Interface
In the final step, I created a user interface in the computer drawing software that can calculate and visualize the information in real-time using the pre-generated data.